NEOrg - Numerical Simulation Organizer v.0.0.1 is released
NEOrg (Numerical Simulation Organizer) is a wiki using the reStructuredText markup.
reStructuredText has a powerful markup called directive which looks like this:
.. directive-name:: argument(s)
   :option: parameter
   :another_option: another_parameter
NEOrg defines special directives to fetch data and images from your data directory to help you organizing your data and finding out more from it.
You can install NEOrg from Python Package Index : neorg. Please see NEOrg Reference Guide for more information.
Toy experimental data for samples
The graph images of the Lissajous curves and the parameter files used to draw it are stored in the directories like this:
lissajous/
 |-- period_x_0.20_period_y_0.20_phase_0.10/
 |   |-- data.yml
 |   `-- fig.png
 |-- period_x_0.20_period_y_0.20_phase_0.15/
 |   |-- data.yml
 |   `-- fig.png
 ...
Three parameters are changed to draw the curve; period of x- and y-axis and phase shift.
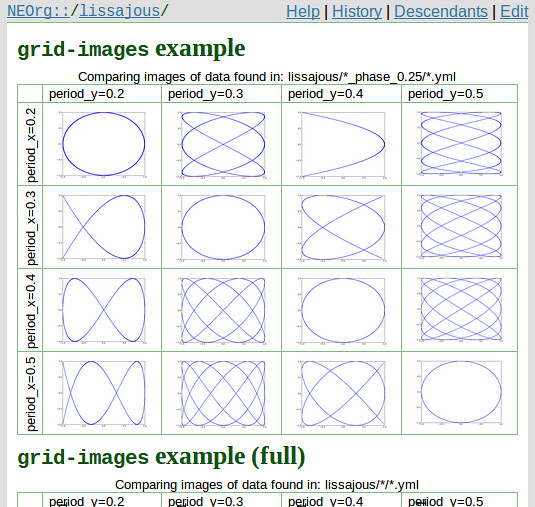
Putting images along the parameters - grid-images
Using grid-images primitive, you can put the images of your experimental results along the parameters.
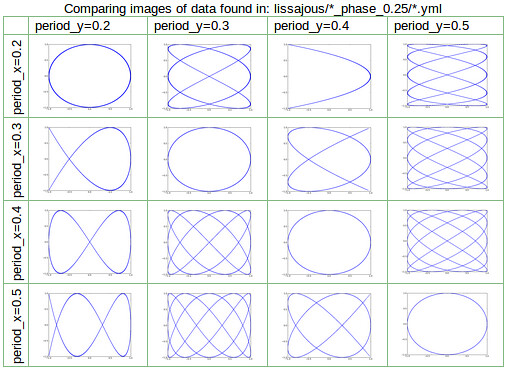
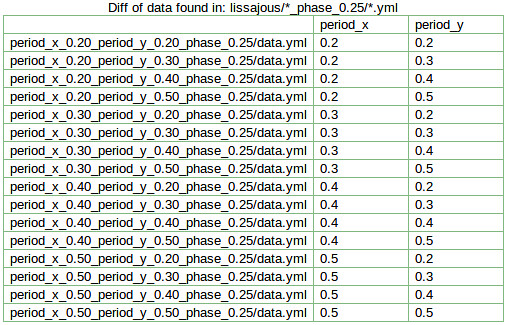
This table is generated by using grid-images like this:
.. grid-images:: *_phase_0.25/*.yml
   :base: lissajous
   :image: fig.png
   :param: period_x period_y
This grid-images directive searches files which match to lissajous/*_phase_0.25/*.yml from the directory where you save the data files, load the data from the file, sort the files by the value of period_x and period_y, and display the image fig.png in the same directory as the data file.
You can choose more than three parameters. In that case, the table will be nested like this:
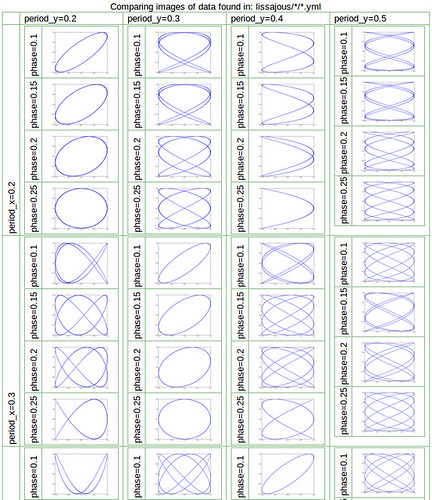
Source code:
.. grid-images:: */*.yml
   :base: lissajous
   :image: fig.png
   :param: period_x period_y phase
(The right most nested table is smaller than the others. There might be something wrong in css or html…)
Putting data and images together - table-data-and-image
This is the directive you use when you want to see the data and the image(s) side-by-side.
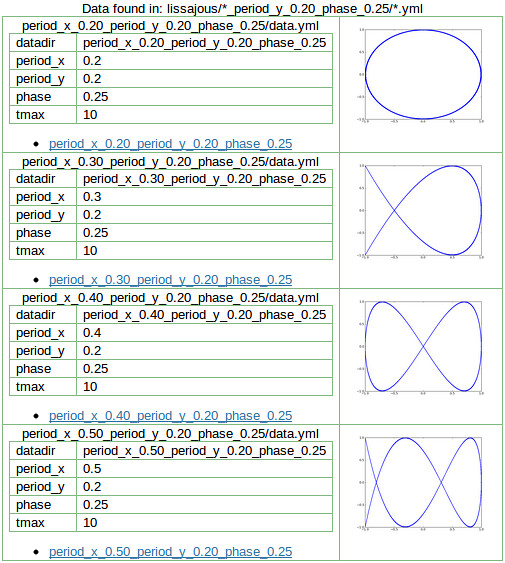
Source code:
.. table-data-and-image:: *_period_y_0.20_phase_0.25/*.yml
   :base: lissajous
   :image: fig.png
   :data: *
   :sort: period_x
   :image-width: 0:150px
   :widths: 6 1
   :link: %(relpath)s
This fetches the data files which match to lissajous/*_period_y_0.20_phase_0.25/*.yml, shows all the data stored in the fiile (:data: *), and puts the image fig.png in the same directory.
Take the difference of the data files - dictdiff
This dictdiff directive shows the difference of the data files. You can see what parameters you changed for the experiment in one table.
Source code:
.. dictdiff:: *_phase_0.25/*.yml
   :base: lissajous
   :sort: phase_x phase_y
   :exclude: datadir
This fetches data files which match to lissajous/*_phase_0.25/*.yml, excludes the key datadir for taking the difference, sorts the files by phase_x and phase_y, and shows the difference of the files.
Template page
This is the most important feature of NEOrg other than the special directives. When you do experiments repeatedly, you may want to see the results in a fixed format. The template page helps you to do that.
Template page is the page which has _temp_ in its URL. For example,
/my/page/_temp_/is a template page. This template page can be used to generate page with the URL matches to it such as
/my/page/2011-06-03-094741/This is an example of the generated page:
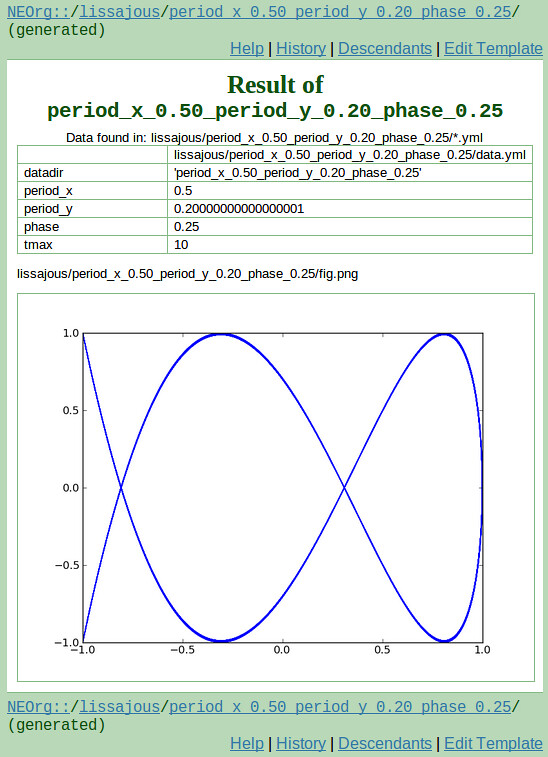
This page is generated from the template page /lissajous/_temp_/ when the page /lissajous/period_x_0.50_period_y_0.20_phase_0.25/ is accessed from the browser. The source of the template page looks like this:
Result of ``{{ args[0] }}``
==============================================================

.. table-data:: /*.yml
   :data: *
   :trans:

.. find-images:: *.png
   :base: {{ path }}
{{ args[0] }} and {{ path }} in the source will be replaced as
{{ args[0] }} --> period_x_0.50_period_y_0.20_phase_0.25
{{ path }}    --> lissajous/period_x_0.50_period_y_0.20_phase_0.25/
resulting in the generated page above.
