When I choose a open-source software from several projects, I’d want to choose more active one. Although some repository service like Google Code provides “activity” information, that was not enough for me because:
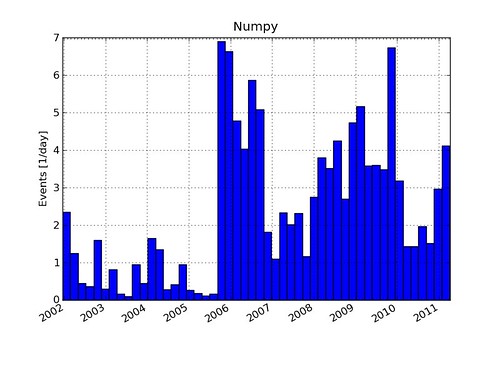
So, I wrote a simple Python script to plot a histogram of commit frequency (number of commit per day).
The figure bellow is an example. It is the histogram of the Numpy repository. You can see, for example, that it became very active since 2006.
For your information, this Python script can read any (point process) data if it is a sequence of an unix time per line. Please let me know if you have some other use of this script!
You can find the script at tkf’s gist: 913543 — Gist or bottom of this post.
Execute this at working directory of the repository of which you want to know the commit frequency.
hg log --template '{date}\\n' | datehist.py
git log --format='%at' | datehist.py
datehist.py
can read the data (the output of hg log
or git log
) like this from stdin:
1298586880
1298516219
1298426531
1298426393
1298418897
1298407083
1298387222
1298387170
1295910432
(... and so on)
This is a sequence of unix time separated by new line \n
.
You can specify the plot title from the command line option -t
. For example, if you want to use the full path of the working directory as the title:
hg log --template '{date}\\n' | datehist.py -t `hg root`
git log --format='%at' | datehist.py -t `git rev-parse --show-toplevel`
I compared the following projects:
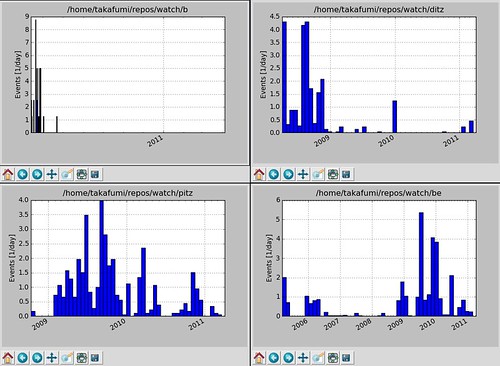
Hmmm… Looks like none of them is very active.
I’m using b for some reason.
You can get the newest one from tkf’s gist: 913543 — Gist.
Note: It looks like you need a local repository to see its log.
#!/usr/bin/env python | |
""" | |
Plot histogram from list of dates | |
Usage | |
===== | |
Feed newline separated unix time via STDIN. | |
Ex.1: plot repository activity:: | |
hg log --template '{date}\\n' | datehist.py -t `hg root` | |
git log --format='%at' | datehist.py -t `git rev-parse --show-toplevel` | |
""" | |
import sys | |
import datetime | |
import numpy | |
from matplotlib import pyplot | |
from matplotlib.dates import YearLocator, MonthLocator, DateFormatter | |
from matplotlib.dates import epoch2num, date2num | |
def num_now(): | |
""" | |
Return the current date in matplotlib representation | |
""" | |
return date2num(datetime.datetime.now()) | |
def get_limit(past): | |
""" | |
Get the date `past` time ago as the matplotlib representation | |
""" | |
return num_now() - float(past) * 365 | |
def read_dates(limit, stream=sys.stdin): | |
""" | |
Read newline-separated unix time from stream | |
""" | |
dates = [] | |
for line in stream: | |
num = epoch2num(float(line.strip())) | |
dates.append(num) | |
if num < limit: | |
break | |
stream.close() | |
return dates | |
def plot_datehist(dates, bins, title=None): | |
(hist, bin_edges) = numpy.histogram(dates, bins) | |
width = bin_edges[1] - bin_edges[0] | |
fig = pyplot.figure() | |
ax = fig.add_subplot(111) | |
ax.bar(bin_edges[:-1], hist / width, width=width) | |
ax.set_xlim(bin_edges[0], num_now()) | |
ax.set_ylabel('Events [1/day]') | |
if title: | |
ax.set_title(title) | |
# set x-ticks in date | |
# see: http://matplotlib.sourceforge.net/examples/api/date_demo.html | |
ax.xaxis.set_major_locator(YearLocator()) | |
ax.xaxis.set_major_formatter(DateFormatter('%Y')) | |
ax.xaxis.set_minor_locator(MonthLocator()) | |
# format the coords message box | |
ax.format_xdata = DateFormatter('%Y-%m-%d') | |
ax.grid(True) | |
fig.autofmt_xdate() | |
return fig | |
def main(): | |
from optparse import OptionParser | |
parser = OptionParser(usage='PRINT_UNIX_TIME | %prog [options]') | |
parser.add_option("-p", "--past", default="3", | |
help="how many years to plot histogram. (default: 3)") | |
parser.add_option("-o", "--out", default=None, | |
help="output file. open gui if not specified.") | |
parser.add_option("-b", "--bins", default=50, type=int, | |
help="number of bins for histogram. (default: 50)") | |
parser.add_option("-t", "--title") | |
parser.add_option("-d", "--doc", default=False, action="store_true", | |
help="print document") | |
(opts, args) = parser.parse_args() | |
if opts.doc: | |
print __doc__ | |
return | |
dates = read_dates(get_limit(opts.past)) | |
fig = plot_datehist(dates, opts.bins, title=opts.title) | |
if opts.out: | |
fig.savefig(opts.out) | |
else: | |
pyplot.show() | |
if __name__ == '__main__': | |
main() |