Calcium channel model
Calcium channel model taken from PyDSTool example. See:
- pydstool/Tutorial_Calcium.py at master · robclewley/pydstool
- Tutorial - PyDSTool Wiki
- Bifurcation Analysis · DifferentialEquations.jl
We define the model parameter using a NamedTuple:
calcium_param = (
    vl = -60,
    vca = 120,
    i = -220.0,
    gl = 2,
    gca = 4,
    c = 20,
    v1 = -1.2,
    v2 = 18,
)
Define the model as in DifferentialEquations.jl:
using Parameters: @unpack

function f(u, p, t)
    @unpack vl, vca, i, gl, gca, c, v1, v2 = p
    v = u[1]
    w = u[2]
    dv = (i + gl * (vl - v) - gca * 0.5 * (1 + tanh((v-v1)/v2)) * (v-vca)) / c
    dw = v-w
    return SVector(dv, dw)
end
f (generic function with 1 method)Create an ODEProblem:
using DiffEqBase: ODEProblem
using StaticArrays: SVector

u0 = SVector(-170.0, -170.0)
tspan = (0.0, 30.0)  # ignored by Bifurcations.jl
ode = ODEProblem(f, u0, tspan, calcium_param)[36mODEProblem[0m with uType [36mStaticArrays.SArray{Tuple{2},Float64,1,2}[0m and tType [36mFloat64[0m. In-place: [36mfalse[0m
timespan: (0.0, 30.0)
u0: [-170.0, -170.0]Create a bifurcation problem:
using Bifurcations: BifurcationProblem
using Setfield: @lens

param_axis = @lens _.i
prob = BifurcationProblem(ode, param_axis, (-300.0, 100.0))
Solve it:
using DiffEqBase: init, solve!

solver = init(prob)
solve!(solver)
sol = solver.sol
Codim1Solution <Continuous>
# sweeps : 2
# points : 106
# branches : 0
# saddle_node : 2
Plot it:
using Plots

plt = plot(sol)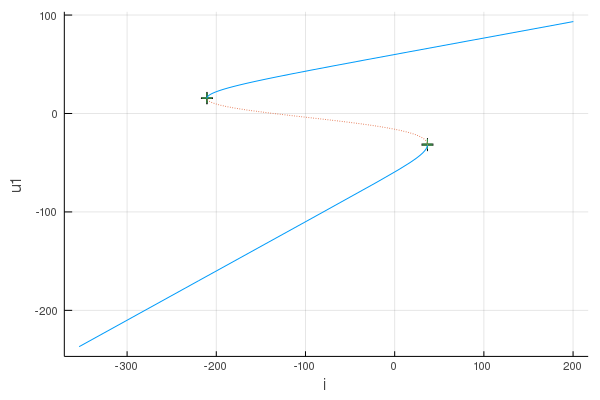
Find the left Saddle-Node bifurcation point:
using Bifurcations: special_intervals

point_list = sort!(special_intervals(solver), by=p->p.u0[end])
point = point_list[1]
SpecialPointInterval <Continuous saddle_node>
happened between:
u0 = [15.36, 15.36, -210.476]
u1 = [15.822, 15.822, -210.44]
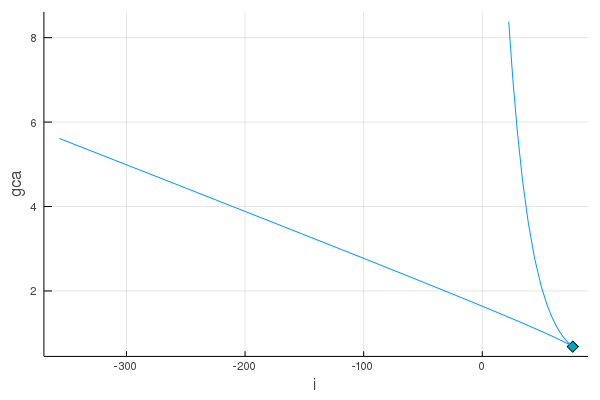
Numerical continuation of the Saddle-Node bifurcation point:
sn_prob = BifurcationProblem(
    point,
    solver,
    (@lens _.gca),
    (0.0, 8.0),
)
sn_solver = init(sn_prob)
solve!(sn_solver)
Codim2Solver <Continuous>
# sweeps : 2
# points : 68
# branches : 0
# cusp : 1
Plot the phase diagram:
plt2 = plot(sn_solver.sol)